Skip to main content

Mississippi
25.6 deaths per 100,000 residents
1.81 deaths per 100 million vehicle miles traveled
The 2026 Car Accident Danger Index ranks the most dangerous states for drivers using traffic fatalities, dangerous driving behavior, vulnerable-road-user deaths, commercial-vehicle risk, roadway exposure and uninsured motorists.
Last Updated: August 2026
Car accident danger cannot be measured by one statistic alone. A state may record a large number of traffic deaths because it has a substantial population, while a less-populated state may have a much higher fatality rate relative to its residents or the number of miles traveled.
The Morgan Law Group developed this national report to compare multiple measures using consistent federal and industry data. Population-adjusted rates, roadway exposure, crash characteristics, driver behavior, and insurance conditions help explain why the risks facing drivers differ considerably from one state to another.
This report expands on our 2026 car accident statistics and is part of The Morgan Law Group Danger Index, an original research platform examining transportation, weather, property, insurance, and geographic risks throughout the United States.
Every state is evaluated using the same core measurements so readers can compare roadway risks across the country.
Crash totals are evaluated alongside population and roadway exposure to provide a more meaningful comparison among states of different sizes.
The index considers fatal crashes, dangerous driving behavior, vulnerable road users, commercial vehicles, roadway exposure, and insurance-related risks.
The rankings use the latest complete and consistently available datasets identified in the report’s methodology and research notes.
Important context: The Car Accident Danger Index is a comparative research report. A state’s ranking does not predict whether a particular driver will be involved in a crash, and roadway conditions can vary substantially by city, highway, time, weather, and driver behavior.
The latest finalized federal data shows that traffic deaths declined nationally in 2024, with preliminary estimates indicating another decrease in 2025. However, roadway danger remains unevenly distributed, and state-level fatality rates can differ substantially from the national average.
NHTSA’s finalized data reports that 39,254 people died in motor vehicle traffic crashes across the United States during 2024.
The 2024 national fatality rate was 1.19 deaths for every 100 million vehicle miles traveled.
NHTSA preliminarily estimates that 36,640 people died in traffic crashes during 2025.
Preliminary figures indicate that national traffic deaths decreased approximately 6.7% from 2024 to 2025.
A declining national fatality rate is encouraging, but it does not mean that every state, city, or roadway experienced the same improvement. NHTSA estimates that fatalities decreased in 39 states, the District of Columbia, and Puerto Rico during 2025, meaning the trend was not uniform across the country.
Population, vehicle miles traveled, rural road exposure, speed, impaired driving, commercial traffic, pedestrian activity, motorcycle use, roadway design, emergency-response times, and insurance conditions can all affect the risks drivers face within an individual state.
For that reason, the Car Accident Danger Index evaluates state-level measurements rather than ranking states solely by their total number of traffic deaths.
Data-year note: The core state rankings use finalized 2024 traffic-fatality records when available. Preliminary 2025 estimates provide current national context but are not substituted for finalized state-level measurements. Source: National Highway Traffic Safety Administration.
The Car Accident Danger Index combines six categories of roadway and insurance risk into a single comparative score. Each category uses state-level measurements adjusted for population, vehicle miles traveled, or another relevant measure of exposure.
The analysis covers all 50 states. Washington, D.C., is not included in the primary ranking because its entirely urban roadway system, population density, and travel patterns are not directly comparable with those of individual states.
Finalized 2024 federal traffic records are used for the core crash and fatality measurements. The most recent consistently available reporting year is used for insurance data and other measures not updated on the same schedule.
Fatalities per 100,000 residents and fatalities per 100 million vehicle miles traveled measure the overall severity of each state’s traffic-death burden.
The percentage of traffic deaths involving speeding, alcohol-impaired driving, and unrestrained passenger-vehicle occupants measures the prevalence of high-risk behavior.
Population-adjusted pedestrian, bicyclist, and motorcyclist fatalities measure the risks facing people with less physical protection during a collision.
Commercial-motor-vehicle fatality and fatal-crash rates measure the danger associated with large trucks, buses, freight corridors, and commercial traffic.
Vehicle miles traveled per resident and the percentage of travel occurring on rural roads measure how extensively—and under what broad conditions—people travel.
The estimated percentage of uninsured motorists measures the likelihood that an injured driver may face additional insurance and financial-recovery complications.
Traffic deaths are divided by the state population and expressed as a rate per 100,000 residents.
Traffic deaths are compared with annual vehicle miles traveled and expressed per 100 million miles.
The analysis measures the percentage of a state’s traffic fatalities classified as speeding-related.
The analysis measures the percentage of fatalities involving a driver with a blood alcohol concentration of .08 or higher.
The percentage of killed passenger-vehicle occupants who were unrestrained is used as an additional behavioral-risk measurement.
Pedestrian and bicyclist deaths are combined and adjusted for each state’s population.
Motorcyclist deaths are adjusted for population to compare the relative burden among states.
Commercial-motor-vehicle fatality and fatal-crash rates are compared using Federal Motor Carrier Safety Administration data.
Annual vehicle miles traveled per resident and rural roadway travel help measure driving exposure and road-environment differences.
The estimated uninsured-motorist rate measures potential exposure to drivers without liability insurance.
The same measurement and reporting year are collected for every state whenever a complete national dataset is available.
Raw totals are converted into population-adjusted, travel-adjusted, or percentage-based measurements to reduce the effect of state size.
Each measurement is converted to a score from 0 to 100 based on its position among the 50 states. Higher values always represent greater measured risk.
Metric scores are combined within each category, and the six weighted category scores produce the final Car Accident Danger Index score.
States are ranked using their unrounded overall scores. If two states have the same displayed score, the state with the higher Traffic Fatality Risk score receives the higher position. If those scores are also equal, the fatality rate per 100 million vehicle miles traveled serves as the second tie-breaker.
A measurement is included only when a comparable value is available for all 50 states. When reporting schedules differ, the analysis uses the latest common year rather than combining mismatched state reporting periods.
Methodology limitation: The index primarily evaluates fatal-crash outcomes because nationally standardized fatality data is more consistent across states than nonfatal injury and property-damage-only crash reporting. Rankings describe comparative statewide conditions and should not be interpreted as predictions about a particular road, driver, or future collision.
Fatality risk accounts for 35% of each state’s overall Danger Index score. This category compares traffic deaths relative to both population and vehicle miles traveled, helping distinguish states with unusually dangerous roads from states that simply have more residents or drivers.
25.6 deaths per 100,000 residents
1.81 deaths per 100 million vehicle miles traveled
16.2 deaths per 100,000 residents
1.74 deaths per 100 million vehicle miles traveled
18.9 deaths per 100,000 residents
1.67 deaths per 100 million vehicle miles traveled
19.5 deaths per 100,000 residents
1.53 deaths per 100 million vehicle miles traveled
16.6 deaths per 100,000 residents
1.52 deaths per 100 million vehicle miles traveled
18.1 deaths per 100,000 residents
1.49 deaths per 100 million vehicle miles traveled
A state’s final ranking also reflects speeding, alcohol involvement, seat-belt use, risks to pedestrians, bicyclists and motorcyclists, commercial-vehicle crashes, roadway exposure and uninsured drivers. A high fatality rate therefore does not automatically determine the state’s overall position.
The Danger Index identifies broader roadway risks, but every collision is different. If you were injured because of another driver, request a free claim review from The Morgan Law Group.
Dangerous driving behavior accounts for 20% of each state’s overall Danger Index score. The analysis compares speeding-related deaths, alcohol involvement among fatally injured drivers and the percentage of fatally injured occupants who were unrestrained.
Speeding contributed to 29% of U.S. traffic deaths in 2024.
An estimated 31% of fatally injured passenger-vehicle drivers nationwide had a blood alcohol concentration of at least 0.08%.
Nationwide, 43% of fatally injured passenger-vehicle occupants were unrestrained in 2024.
Speeding, impaired driving and failure to use a seat belt can increase both the likelihood of a serious collision and the severity of resulting injuries. States that perform poorly across several behavioral measures receive a higher dangerous-driving score.
Alcohol estimates should be interpreted with caution where state BAC reporting was limited. Source: IIHS analysis of 2024 NHTSA data.
People traveling without the protection of an enclosed vehicle face a greater risk of serious or fatal injury during a collision. Vulnerable-road-user risk accounts for 15% of each state’s overall Danger Index score and is adjusted for population.
7,080 pedestrians were killed in U.S. motor vehicle crashes during 2024.
New Mexico, Louisiana, Arizona, Nevada and Florida recorded notably high combined pedestrian and bicyclist fatality rates relative to population.
1,075 bicyclists were killed nationwide during 2024.
Florida recorded 201 bicyclist deaths, the highest total among the states, while California recorded 162 and Texas recorded 79.
6,228 motorcyclists were killed in U.S. crashes during 2024.
After adjusting for population, Wyoming, South Dakota and Montana showed particularly elevated motorcyclist fatality rates.
Large states often record the greatest number of deaths because they have more residents. Calculating fatalities per 100,000 people helps identify where pedestrians, bicyclists and motorcyclists face disproportionately high risk.
Rates calculated using 2024 state population and fatality data. Source: IIHS analysis of NHTSA data.
Commercial-vehicle risk accounts for 10% of each state’s overall Danger Index score. This category evaluates fatalities and fatal crashes involving large trucks or buses relative to the total number of miles traveled within each state.
The federal definition used in this analysis includes large trucks and buses. Fatalities may involve commercial-vehicle occupants or other road users involved in the same crash.
This measure compares the number of people killed in commercial-vehicle crashes with every 100 million vehicle miles traveled in the state.
This measure compares the number of separate fatal commercial-vehicle crashes with total statewide travel, reducing the influence of population and state size.
85 fatalities in commercial-vehicle crashes
61 fatalities in commercial-vehicle crashes
114 fatalities in commercial-vehicle crashes
States with major freight corridors naturally experience more commercial traffic. Adjusting fatal crashes and fatalities for total vehicle miles traveled provides a more meaningful comparison of roadway risk across states.
Source: Federal Motor Carrier Safety Administration CMV Fatality Rate Report and CMV Fatal Crash Rate Report.
Roadway exposure accounts for 10% of each state’s overall Danger Index score. The category combines annual vehicle miles traveled per resident with the percentage of statewide travel occurring on rural roads.
States where residents and visitors collectively travel more miles create greater exposure to potential collisions. Total statewide vehicle miles are divided by population for a fair comparison.
Rural roads may involve higher travel speeds, longer distances between destinations, limited lighting and longer emergency-response times.
The index evaluates how frequently road users are exposed to these conditions instead of treating a state’s size or total mileage as a risk factor by itself.
Approximately 73.4% of statewide travel occurred on rural roads.
Approximately 58.7% of statewide travel occurred on rural roads.
Approximately 12,192 vehicle miles were traveled per resident.
This category does not suggest that rural drivers are less responsible or that driving more miles automatically makes a state unsafe. It measures how frequently road users encounter conditions associated with greater crash exposure.
Rates calculated using 2024 vehicle-mile and population data. Source: Federal Highway Administration Highway Statistics 2024, Table VM-2.
Uninsured-motorist exposure accounts for 10% of each state’s overall Danger Index score. A higher uninsured-driver rate can increase the financial risk of a collision and make recovering compensation more difficult for injured drivers.
An estimated 14% of U.S. motorists were uninsured in 2022, equivalent to approximately one out of every seven drivers.
When an at-fault driver has no liability insurance, injured people may need to rely on their own uninsured-motorist coverage or pursue other available sources of recovery.
The index uses Insurance Research Council estimates based on uninsured-motorist and bodily-injury insurance claim frequencies.
Nearly one in four motorists was estimated to be uninsured.
More than one in five motorists was estimated to be uninsured.
Approximately one in five motorists was estimated to be uninsured.
Uninsured- and underinsured-motorist coverage may help pay for qualifying losses when an at-fault driver has no insurance or insufficient coverage. Available benefits depend on the policy and applicable state law.
The District of Columbia is excluded from the 50-state rankings. Source: Insurance Information Institute and Insurance Research Council.
The final Danger Index score combines traffic fatalities, dangerous driving behavior, vulnerable-road-user deaths, commercial-vehicle risk, roadway exposure and uninsured motorists. Higher scores indicate greater comparative risk among the 50 states.
New Mexico combines high fatality rates with the country’s highest uninsured-motorist exposure, elevated vulnerable-road-user deaths and one of the highest commercial-vehicle fatality rates.
South Carolina ranks near the top for population- and mileage-adjusted traffic deaths while also recording elevated speeding, alcohol involvement and vulnerable-road-user risk.
Montana’s score reflects high fatality rates, dangerous driving behavior, extensive rural travel and elevated commercial-vehicle crash exposure.
Mississippi recorded the nation’s highest traffic death rates per resident and per mile traveled, along with high uninsured-motorist, commercial-vehicle and roadway-exposure risk.
Arkansas ranks highly because of elevated fatality rates, substantial rural-road exposure, commercial-vehicle risk and an above-average uninsured-motorist rate.
Arizona has one of the country’s highest mileage-adjusted traffic death rates and particularly high pedestrian, bicyclist and motorcyclist fatality risk.
Alabama’s ranking is driven by elevated traffic deaths, unrestrained-occupant fatalities, roadway exposure and commercial-vehicle crash risk.
Oklahoma records elevated fatality rates, speeding-related deaths, commercial-vehicle risk and extensive roadway exposure.
South Dakota’s ranking reflects substantial rural travel, elevated motorcyclist deaths, low restraint use and the highest commercial-vehicle risk score in the index.
Tennessee combines high population- and mileage-adjusted fatality rates with one of the nation’s highest estimated percentages of uninsured motorists.
A score of 84.2 does not mean that 84.2% of drivers will experience a crash. It represents the state’s weighted position relative to the other 49 states across the six risk categories included in the index.
Statewide statistics cannot determine who was responsible for an individual collision. Tell The Morgan Law Group what happened and find out whether your injury claim may qualify for review.
The table below ranks every state from highest to lowest comparative driving risk. Scores range from 0 to 100 and reflect each state’s position across all six weighted risk categories.
| Rank | State | Danger Index Score | Risk Level |
|---|---|---|---|
| 1 | New Mexico | 84.2 | Very High |
| 2 | South Carolina | 81.8 | Very High |
| 3 | Montana | 76.7 | Very High |
| 4 | Mississippi | 75.8 | Very High |
| 5 | Arkansas | 75.0 | Very High |
| 6 | Arizona | 72.7 | High |
| 7 | Alabama | 72.4 | High |
| 8 | Oklahoma | 72.3 | High |
| 9 | South Dakota | 69.3 | High |
| 10 | Tennessee | 67.7 | High |
| 11 | Wyoming | 66.8 | High |
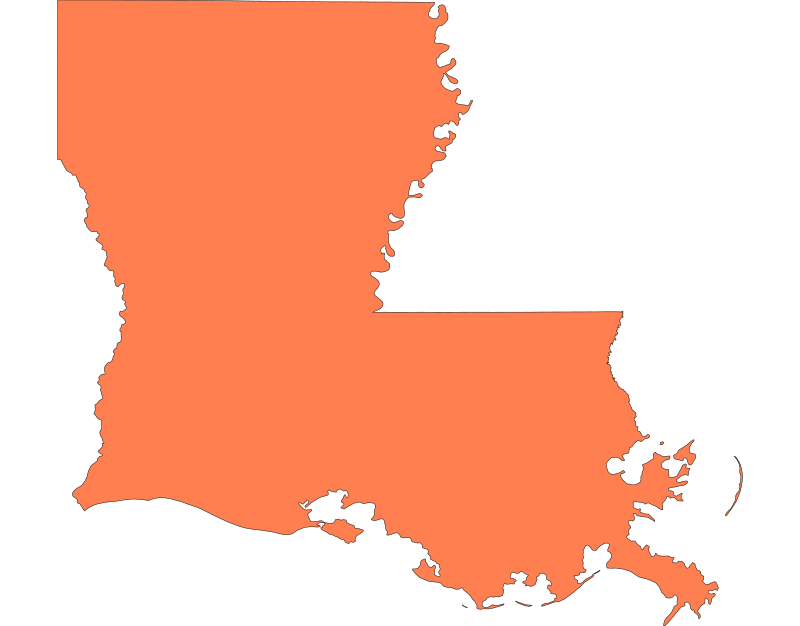
| 12 | Louisiana | 65.6 | High |
| 13 | Missouri | 64.3 | High |
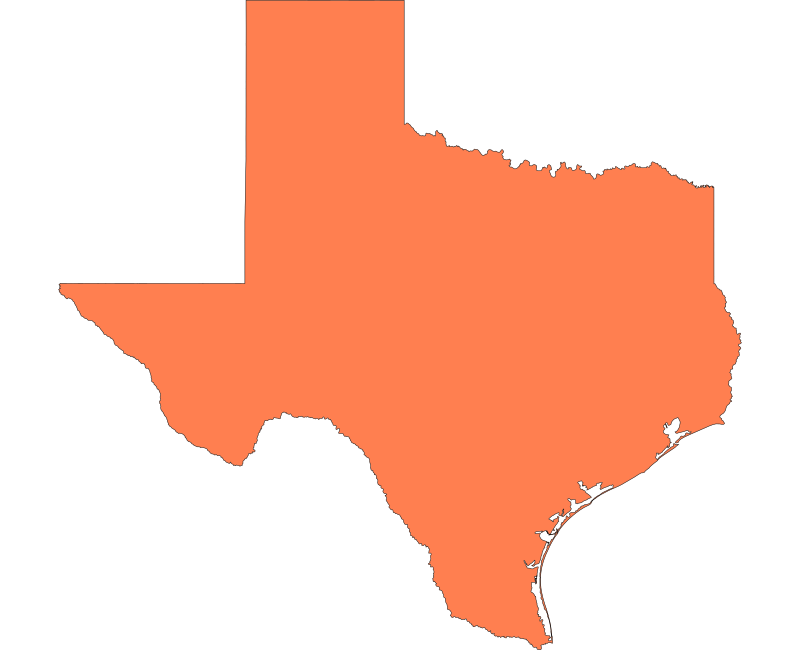
| 14 | Texas | 63.9 | High |
| 15 | Kentucky | 63.0 | High |
| 16 | Colorado | 61.1 | High |
| 17 | Oregon | 60.1 | High |
| 18 | Delaware | 59.0 | Moderate |
| 19 | West Virginia | 58.6 | Moderate |
| 20 | Nevada | 57.8 | Moderate |
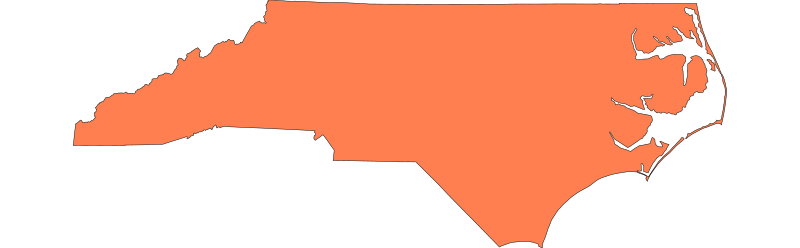
| 21 | North Carolina | 57.8 | Moderate |
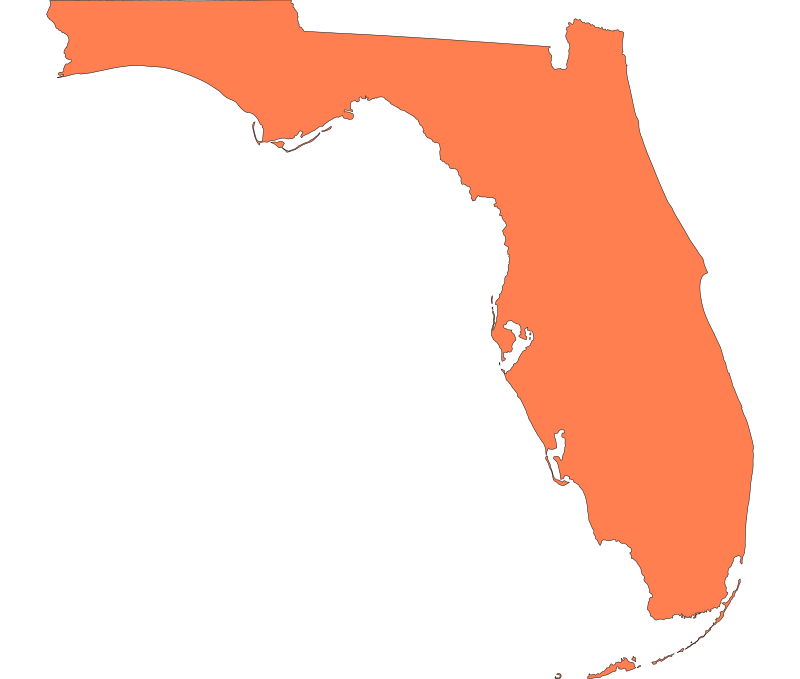
| 22 | Florida | 55.4 | Moderate |
| 23 | Georgia | 50.3 | Moderate |
| 24 | Nebraska | 49.1 | Moderate |
| 25 | Maine | 48.0 | Moderate |
| 26 | Idaho | 46.2 | Moderate |
| 27 | California | 45.9 | Moderate |
| 28 | Alaska | 43.8 | Moderate |
| 29 | Indiana | 42.7 | Moderate |
| 30 | Washington | 42.2 | Moderate |
| 31 | Kansas | 41.8 | Moderate |
| 32 | Virginia | 40.8 | Moderate |
| 33 | Ohio | 40.6 | Moderate |
| 34 | North Dakota | 39.7 | Lower |
| 35 | Pennsylvania | 39.0 | Lower |
| 36 | Iowa | 38.9 | Lower |
| 37 | Illinois | 38.6 | Lower |
| 38 | Wisconsin | 38.4 | Lower |
| 39 | Michigan | 38.3 | Lower |
| 40 | Hawaii | 37.9 | Lower |
| 41 | Vermont | 36.9 | Lower |
| 42 | Connecticut | 32.4 | Lower |
| 43 | Maryland | 32.3 | Lower |
| 44 | New Hampshire | 30.9 | Lower |
| 45 | Rhode Island | 26.8 | Lower |
| 46 | Utah | 22.3 | Lowest |
| 47 | New York | 20.5 | Lowest |
| 48 | New Jersey | 20.1 | Lowest |
| 49 | Minnesota | 19.6 | Lowest |
| 50 | Massachusetts | 14.6 | Lowest |
Risk levels: Very High, 75–100; High, 60–74.9; Moderate, 40–59.9; Lower, 25–39.9; Lowest, below 25. Review the complete scoring process in the Danger Index Methodology and Data Center.
The complete rankings show that roadway danger is not determined by population or traffic deaths alone. The states with the highest scores typically perform poorly across several risk categories at the same time.
The highest-risk tier is concentrated in the South, Southwest and Mountain West. These regions frequently combine elevated fatality rates with rural travel, dangerous driving behavior and commercial-vehicle exposure.
Mississippi recorded the highest fatality rates but ranked fourth overall because its behavioral-risk score was lower than several competing states. New Mexico ranked first because it performed poorly across a broader combination of categories.
Montana, South Dakota and Wyoming ranked higher than their populations might suggest because of extensive rural travel, elevated commercial-vehicle risk and other population-adjusted factors.
California ranked 27th, New York ranked 47th and Massachusetts ranked 50th. Adjusting deaths and crashes for population and vehicle miles prevents large states from ranking poorly simply because they record more total collisions.
Mississippi ranked 4th, Louisiana 12th, Texas 14th, North Carolina 21st, Florida 22nd and Georgia 23rd. Explore the individual state indexes for localized crash, weather, property and insurance risks.
Explore localized data covering traffic crashes, dangerous roads, severe weather, property risk and insurance-related challenges in the states served by The Morgan Law Group.
Florida ranks 22nd nationally. Explore risks involving traffic crashes, hurricanes, flooding, property damage and insurance claims.
Georgia ranks 23rd nationally. Review dangerous cities, roadway risks, severe weather and property-insurance concerns.
Louisiana ranks 12th nationally. Examine elevated roadway risk, hurricane exposure, flooding and insurance-claim challenges.
Mississippi ranks fourth nationally and recorded the country’s highest population- and mileage-adjusted traffic fatality rates.
North Carolina ranks 21st nationally. Explore roadway fatalities, coastal storms, flooding and property-insurance risks.
Texas ranks 14th nationally. Review traffic fatalities, commercial-vehicle risk, hurricanes, flooding and property damage.
Answers to common questions about the 2026 state rankings, data sources and scoring methodology.
New Mexico ranks as the most dangerous state for drivers in the 2026 Car Accident Danger Index, with an overall score of 84.2. Its ranking reflects elevated traffic fatalities, vulnerable-road-user deaths, commercial-vehicle risk, rural-road exposure and uninsured motorists.
Mississippi recorded the highest 2024 traffic fatality rates by both measures used in the index: 25.6 deaths per 100,000 residents and 1.81 deaths per 100 million vehicle miles traveled.
Each state receives percentile-based scores across six categories: traffic fatalities, dangerous driving behavior, vulnerable road users, commercial vehicles, roadway exposure and uninsured motorists. The weighted category scores are combined into an overall score from 0 to 100.
No. Raw crash and death totals often reflect population size. The Danger Index primarily uses rates adjusted for population or vehicle miles traveled so states can be compared more fairly.
Finalized federal crash data typically becomes available after a reporting and validation period. The 2026 report uses final 2024 NHTSA, FHWA and FMCSA data because it is the most recent complete dataset available for consistent state-by-state comparisons.
The report is designed as a comparison of the 50 states. Washington, D.C. is excluded because it is a federal district and has travel, population and roadway characteristics that differ substantially from most states.
No. A lower score means the state performed better relative to other states across the selected metrics. Serious and fatal crashes can occur in every state, and risk can vary substantially by city, roadway, time and driving conditions.
No. The Danger Index describes statewide risk patterns and cannot determine fault or legal rights after an individual collision. Claim eligibility depends on the facts of the crash, applicable law, available insurance and resulting damages.